- Overall online revenue increased by 23% in 2017, accelerating from 15% growth the previous year.
- Every sector tracked saw at least 15% online revenue growth, with particularly large gains for Environmental (34%) and Rights (37%) nonprofits.
- Nonprofits received an average of 28% more online gifts in 2017 than 2016.
- On average, 38% of donors who made an online gift to a nonprofit in 2016 made an online gift again to that nonprofit in 2017.
- Retention was 25% for donors who made their first gift in 2016, and 60% for repeat donors (who gave at least one gift before 2016, and again in 2016).
- Revenue from one-time gifts increased by 19% in 2017.
- Remarketing on Facebook, Google Adsense, Twitter, or LinkedIn can increase traffic to your donation pages.
- In one case study, a nonprofit used Custom Facebook Audiences to drive 63% more online donations.
- Revenue from monthly giving grew 23% compared to 13% growth for one-time giving.
- Pre-selecting monthly giving on your donation page can increase conversions of monthly donations by up to 35%.
- Email messaging accounted for 26% of all online revenue.
- Live Chat Support increase audience engagement rates to drive 45% more opt-in conversions.
- For every 1,000 fundraising messages sent, nonprofits raised $42.
- There were noticeable differences in this metric by nonprofits’ size. Small nonprofits (under 100,000 email subscribers) received $71 per 1,000 fundraising emails sent; Medium nonprofits (100,000–500,000 email subscribers) received $36; and Large nonprofits (over 500,000 subscribers) received $32.
Online Fundraising Statistics For Nonprofits
Online Giving Continues 6 Years Of Growth
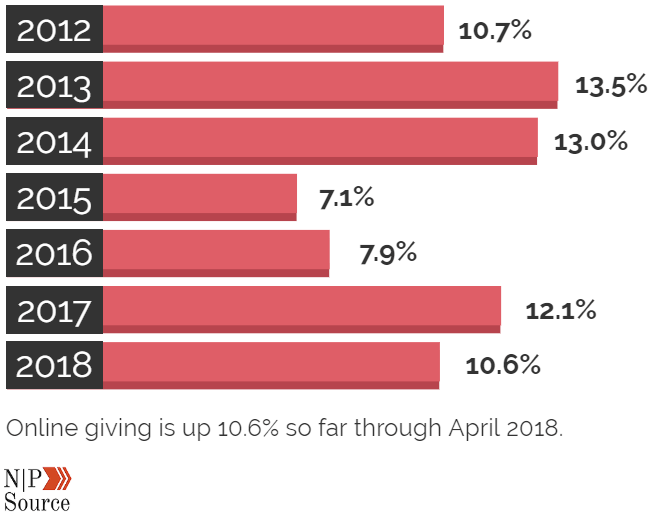
- Online giving grew 12.1% in 2017.
- Online giving has seen consistent year over year growth:
- 2012: $19.2 billion
- 2013: $21.2 billion
- 2014: $24.1 billion
- 2015: $25.8 billion
- 2016: $27.8 billion
- 2017: $31 billion
- 54% of donors worldwide prefer to give online with a credit or debit card.
- 11% prefer direct mail.
- 11% prefer cash.
- 10% prefer bank/wire transfer.
- 9% prefer Paypal.
- 4% prefer mobile app/wallet.
- 1% prefer text message.
- $128 dollars is the average online donation amount.
- $326 dollars is the average annual donation total for recurring donors.
- 67% of nonprofits across the globe are set up to accept online donations.
- On December 31st, online giving is concentrated between 12 PM and 7 PM.
- On December 31%, online giving is concentrated between 12PM – 7PM.
- Custom-branded donation pages nested inside a nonprofit’s website raise 6X more money.
- Only 3% of charities rate their board and executive leadership as being digitally savvy.
- 66% of charities are worried they will miss out on opportunities for digital fundraising.
- Direct mail motivated 36% more donors to give online in 2016 compared to previous year.
- 51% of high-wealth donors ($200k+) prefer to give online.
- 34% of nonprofits have paid for advertising on social media.
- 21% of donations are directly through social.
Monthly Giving Statistics
- 45% of donors enrolled in a monthly giving program.
- The average monthly online donation is $52 ($624 per year) compared to the average one-time gift of $128.
- Monthly giving revenue increased by 40% in 2017.
- Monthly giving accounted for 14% of all online revenue in 2016, and 16% of online revenue in 2017.
- Donors that set up recurring donations give 42% more annually, compared to one-time donations.
- 52% of Millennials are more likely to give monthly over a large one-time donation.
Nonprofit Website Engagement
- Nonprofits raised $1.13 per website visitor in 2017.
- International nonprofits raised the most, $4.11 per visitor, while the Rights sector had the lowest revenue per visitor at $0.31.
- Overall, 1.1% of website visitors made a donation, an increase of 18% over 2016.
- Website traffic declined slightly in 2017, with 1.4% fewer visitors per month.
- Half of nonprofit website traffic came from mobile and tablet users.
General Online Fundraising Statistics
- Only 3% of charities rate their board and executive leadership as being digitally savvy.
- 66% of charities are worried they will miss out on opportunities for digital fundraising.
- Direct mail motivated 36% more donors to give online in 2016 compared to previous year.
- 51% of high-wealth donors ($200k+) prefer to give online.
- 34% of nonprofits have paid for advertising on social media.
- 21% of donations are directly through social.
Read the full list of charitable giving statistics