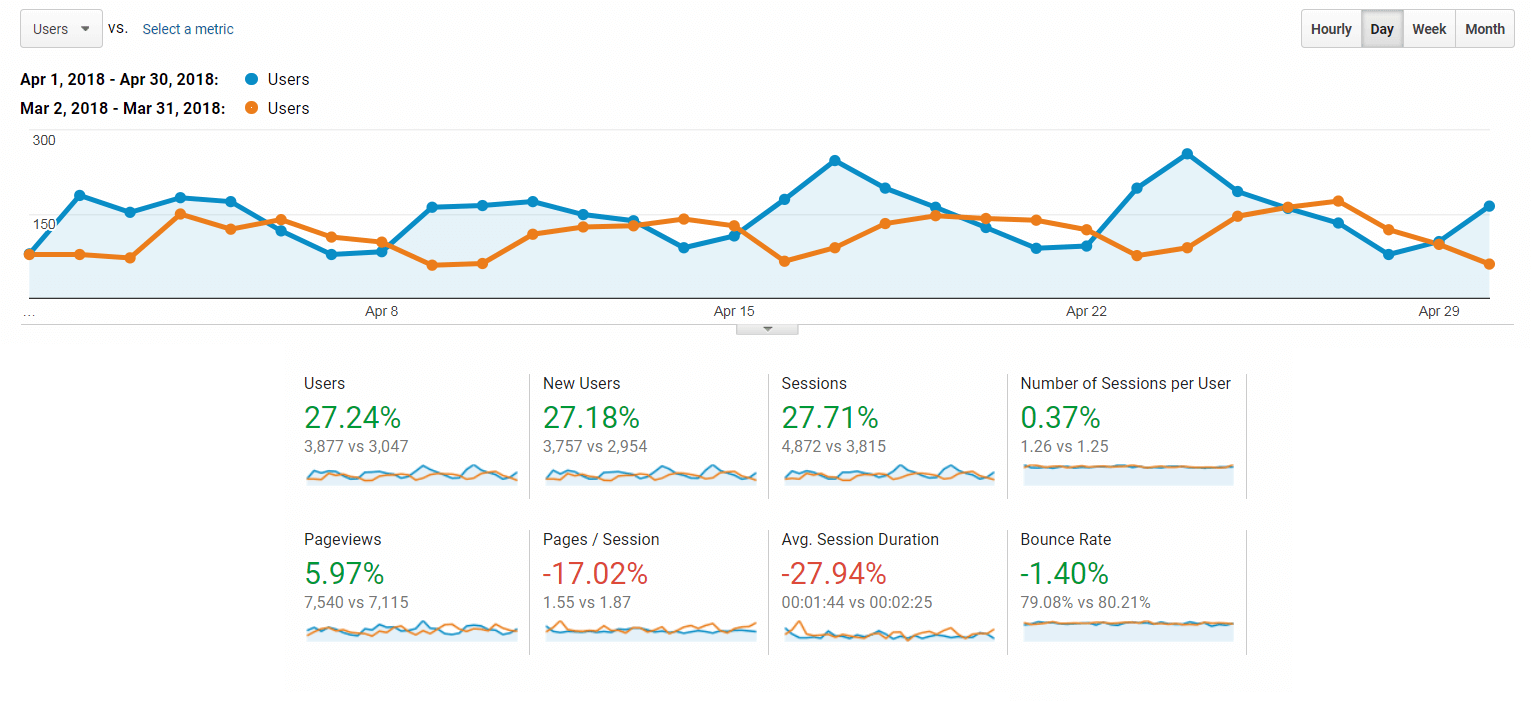
Key Findings:
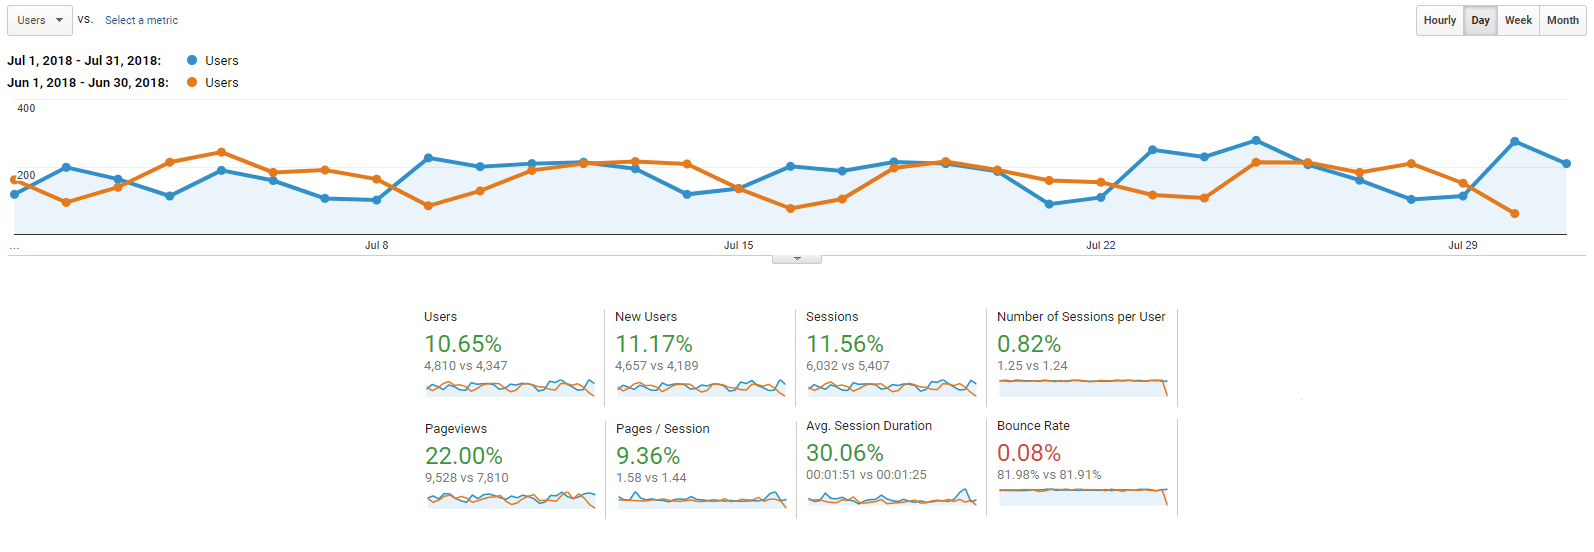
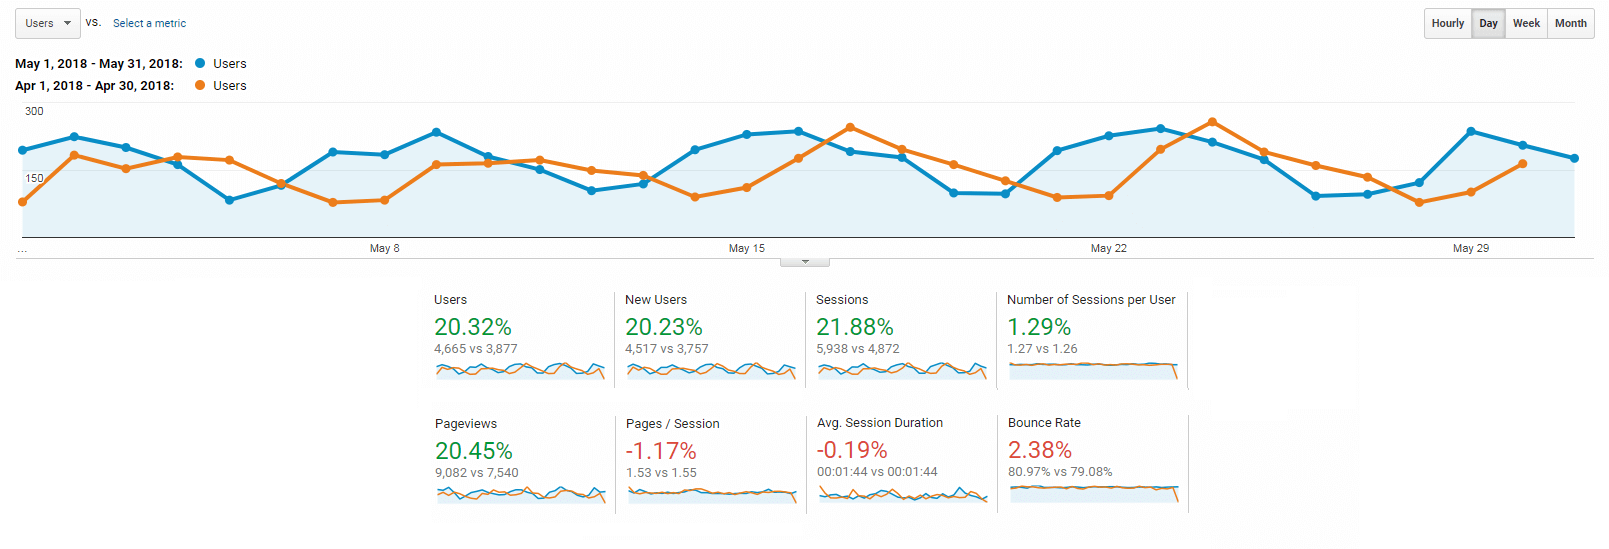
- Total traffic is up 20.32%, 4,665 vs 3,877
- Organic traffic grew 16.89%, 3,446 vs 2,948
- Social media traffic is up 94.62%
- Referral traffic from Twitter grew 161.54%
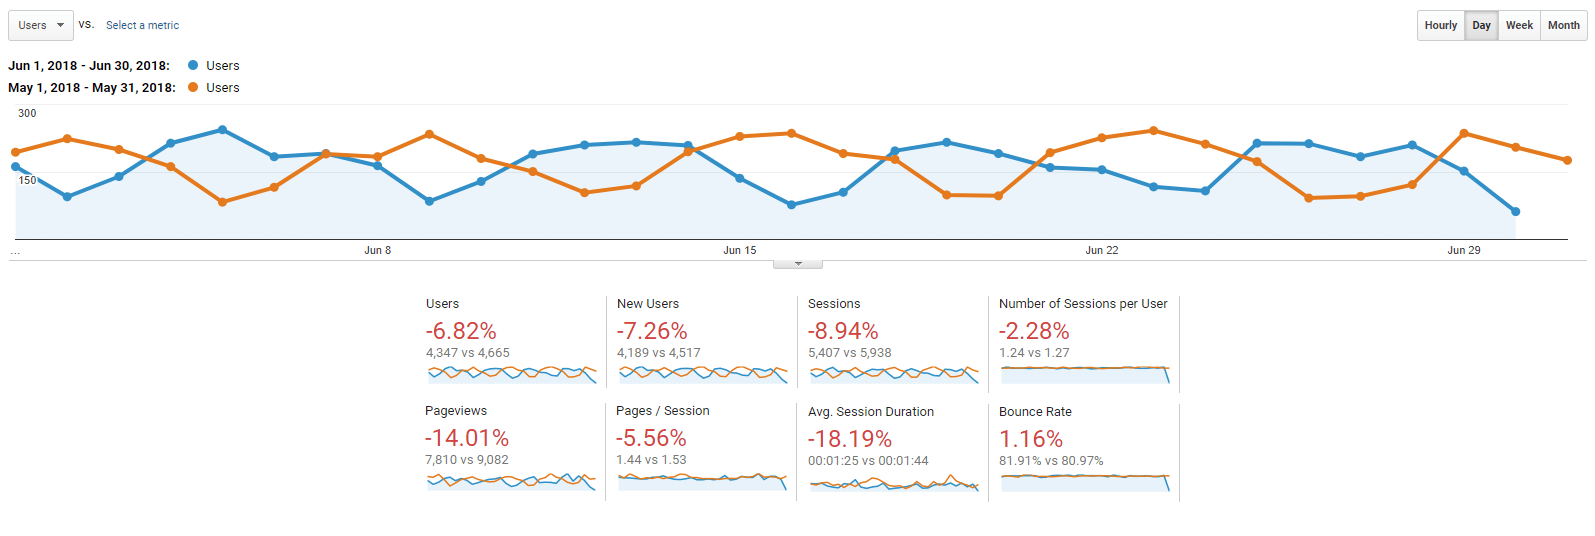
Total traffic missed expectations by 1.6%, however, grew by 20.32% from 4,665 vs 3,757. Traffic growth is down 10% from previous month.
Our organic search traffic missed expectations by 4.5%, however, still grew 13.61% from 3,446 visits to 3,033. This is down 16.39% from previous month.
While difficult to pinpoint the exact cause of this slowing growth, we can confirm Memorial Day weekend significantly impacted results, resulting in a loss of 300 visits from the previous month.
That being said, we do have a plan. Our focus in May was to launch and promote our social media marketing resources page for nonprofits. Back in late March, we published a resource page (4,000-5,000 words) about social media. It included resources for strategic planning, implementing winning tactics as well as providing helpful tools and downloadable templates.
In addition, we reached out to key influencers in the social media and nonprofit space asking them the following question:
“What is your number one social media tip for nonprofits that want to grow and retain their audience online?”
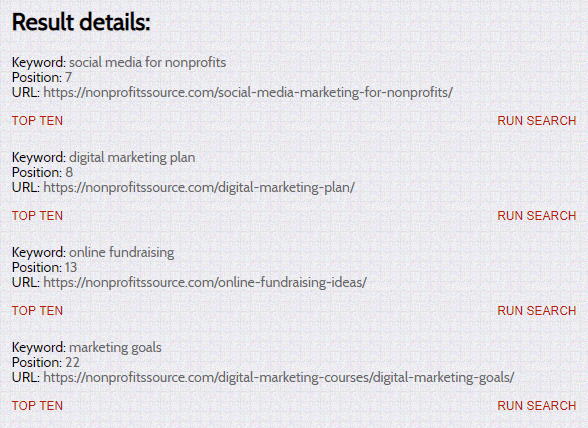
We’re seeing strong positive activity in our keyword growth for the page and expect it to begin generating 100 – 200 views per month in June. Ultimately, our goal is for the page to drive over 2,000 monthly visits. In order to reach this goal, we’ve reached out as part of our promotion outreach to obtain high-quality backlinks to the page. This, in combination with lower keyword difficulty and our domain/topic authority, has already positioned over 20 keywords, totaling 700 organic clicks per month, on the first page.
Our online giving statistics page continues to grow, amassing nearly 100 referring domain links to the page. With 3,912 total page views in May, this page represents 43.07% of the total traffic to the website, down from 71% in April.
This massive shift was caused by a reaction to the backlinks earned on the online giving statistics page. For example, our online fundraising ideas and strategies resource grew 60.22% (181 to 290) visitors during May, as did our blog page receiving 66.33% (98 to 163) more traffic.
When a single page receives a large quantity of high quality backlinks other pages on your site receive that “link juice” in the form of link equity if you have internal links or domain authority, thereby influencing your entire domain. In this case, the latter happened. With an influx of high-quality backlinks, other pages on my site have begun to rank as Google has begun to trust the content on my site.
The Twitter accounts have also been a wealth of opportunities, from sharing content to getting guest contributions and even audience feedback. To date, we have grown the @nonprofitsource and @jfirch Twitter accounts by 600 relevant followers. As a result, our referral traffic from twitter grew 161.54% (26 to 68). Overall referral traffic from social media grew 94.62% (93 to 181).
To increase our Twitter traffic we scheduled 30 posts using HootSuite and auto-scheduled them throughout the day 5x a day. Then, we followed 100 niche people and companies on Twitter that fit our target audience. People have begun to follow back and offer invaluable insight and feedback to our site, for which we are extremely grateful. Next, we sent direct messages to people asking if they wanted to collaborate, start a conversation, or even offer feedback.
Finally, we have invested significant resources in updating older pieces of content that we hope to re-release soon. This is a big play for us and if things go well we will expect a huge spike in traffic.
P.S. Stay tuned for Parts 2 and 3 of our free digital marketing course, which will be released in June!

